A team making 42% of its threes can look like a better perimeter offense than one making 36%. But percentages alone leave out how many shots were taken and how the offense created them.
Count the attempts
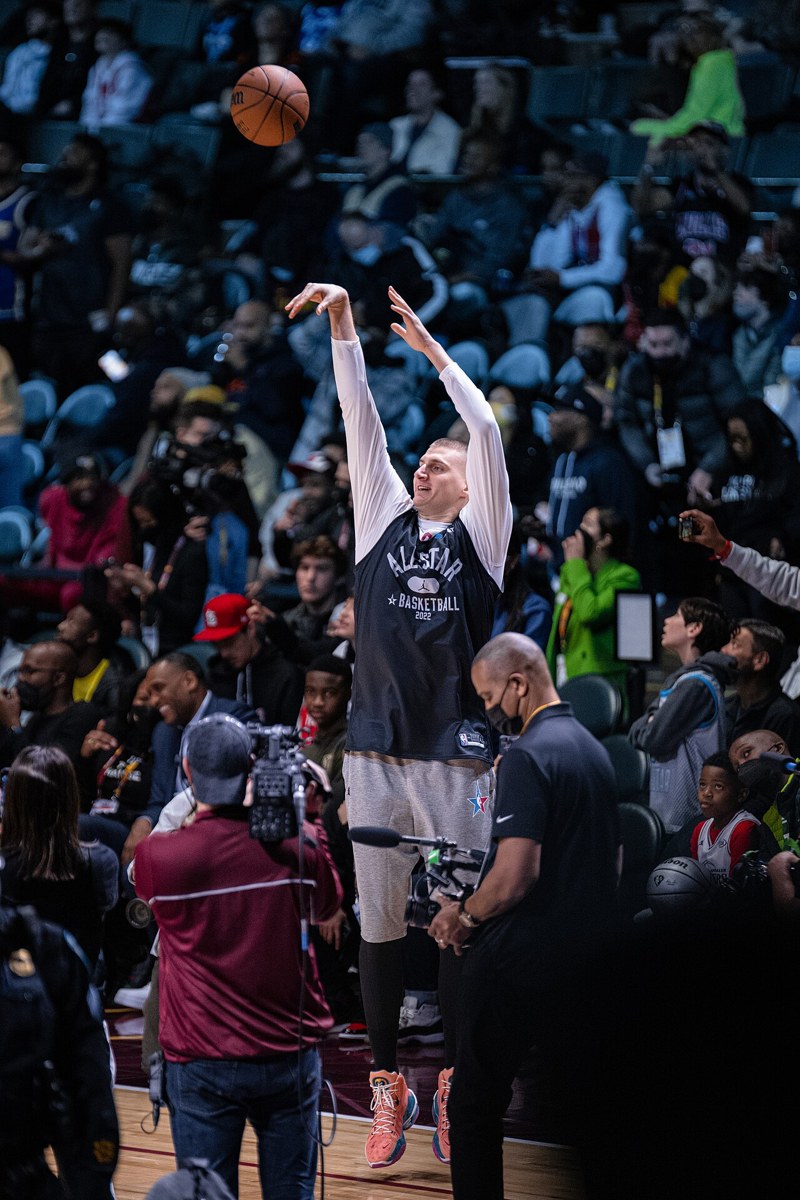
Separate three-point percentage from three-point attempt rate: the share of field-goal attempts taken from beyond the arc. The first describes accuracy. The second describes the offense's shot selection.
Use attempts per possession when comparing games played at different speeds. A fast team can take more threes per game without devoting a larger share of its offense to them.
An illustrative comparison
| Team | Three-point attempts | Makes | Accuracy | Points from threes |
|---|---|---|---|---|
| A | 24 | 10 | 41.7% | 30 |
| B | 40 | 14 | 35.0% | 42 |
Team A shoots the higher percentage. Team B produces 12 more points from threes. Neither is automatically the stronger offense: you still need to examine what happened on the possessions that ended elsewhere.
Review the shot source
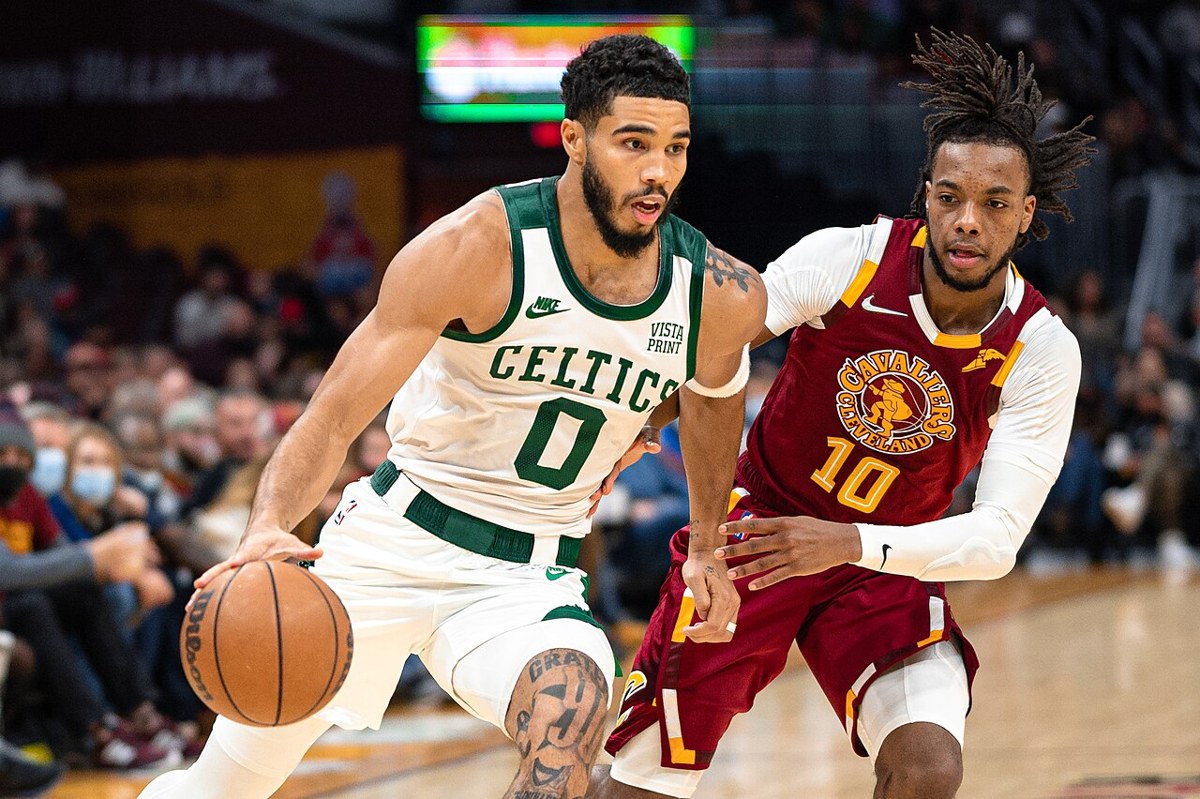
An open catch-and-shoot attempt created by a paint touch is different from a contested pull-up late in the clock. Identify whether threes come from transition, pick-and-roll kick-outs, post passes, offensive rebounds or isolated shot creation.
The source matters because the next defense may remove it. An opponent that keeps the ball out of the paint can reduce clean perimeter chances even if the shooters themselves have not changed.
Account for the shooters on the floor
A team average can hide a lineup problem. If two low-volume shooters share the floor, defenders may help more aggressively toward the ball. The effect can appear as a decline in rim attempts or an increase in turnovers rather than simply a lower three-point percentage.
Review who takes the attempts, which combinations produce them and whether injuries have shifted shots toward less reliable options. A change in role can matter more than a player's most recent percentage.
Accuracy moves faster than the underlying plan
A handful of makes can swing a short sample sharply. Track whether the team continues to create the same quality of attempts when shots stop falling. Consistent shot creation offers a clearer explanation than a claim that the team has become permanently hot or cold.
For defenses, distinguish suppressing attempts from surviving misses. A low opponent percentage does not prove a repeatable advantage if the defense repeatedly allows the shots an offense wants.
A practical checklist
- Record attempts and makes separately.
- Compare attempt rate or attempts per possession.
- Identify the actions producing open looks.
- Check the shooters in the current rotation.
- Review how the opponent defends the paint and close-outs.
- Keep one night's accuracy separate from the longer-term offensive plan.
ISR analysis: Three-point shooting is easier to understand when volume, quality and accuracy are treated as distinct questions. The percentage explains the result; the possession sequence explains how the opportunity was created.